Trends
Omdia research finds US virtual pay TV users over-index substantially in video services
New research from Omdia has found that the average virtual pay TV user utilized 13.5 video services per month compared to the average video household* at 7.4 services during 2021. The latest outlook comes from Omdia’s TV & Online Video Intelligence Service, which provides subscription video on demand (SVOD), advertisement-based video (AVOD), and pay TV revenue forecasts across 100 territories worldwide.
In the US, traditional pay-TV subscriptions saw a 7% decline in 2021, ending the year with 69.7 million households (HH) with a traditional pay-TV subscription. Of the 125.1 million TV HH in the US, 55.4 million will be left without a traditional linear experience. At the end of 2021, there were 13.6 million virtual pay-TV subscriptions in the US representing approximately 11% of TV households.
In consumer surveys, virtual multiprogramming video distributors (vMVPD) customers rate the user experience higher for virtual pay TV than SVOD, AVOD, or traditional pay TV. Sarah Henschel, Principal Analyst at Omdia, commented: “Because virtual pay-TV services are internet-based and have no long-term contracts like traditional pay TV, user interfaces and experiences are received well and can adapt to changing customer needs.”
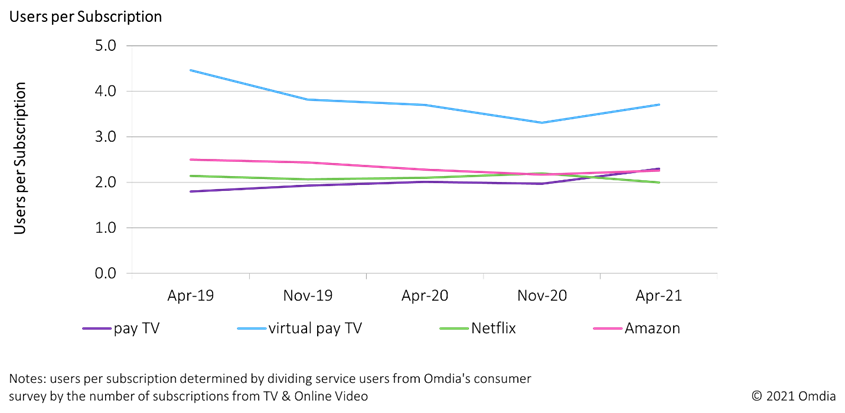
vMVPD Users per Subscription
Omdia analysis also shows that virtual pay TV in the US has continued to have more users per subscription than each traditional pay TV, Netflix, and Amazon. In April 2021, virtual pay TV had 3.7 users per subscription on average while traditional pay TV had 2.3. This higher proportion of users to subscriptions may be multiple households sharing one singular virtual pay-TV subscription. Unlike pay TV, some virtual pay-TV services offer multiple profiles per subscription, which could encourage password sharing. Splitting a virtual pay-TV subscription across two households would also bring down the high cost of virtual pay TV that consumers have been reluctant to get locked into.
YouTube TV is the driver of services with user over-indexing; in April 2021, YouTube TV accounted for 26% of total virtual pay-TV subscriptions but 39% of total virtual pay-TV users. Virtual pay-TV users also typically skew younger than the average pay-TV and SVOD users, meaning they may be more tech-savvy and more likely to seek content post-cord-cutting. While password sharing and subscription sharing may initially seem like a bad trend for service growth, it has proven to be quite the opposite for YouTube TV. As a service, it has the most users per subscription, but that growth has allowed it to become the number one service in the US.
Henschel continued: “these users are more than twice as likely to use transactional video services (both retail and rental), with this growing to 3x as likely for premium video on demand (PVOD) and more than 5x for sport pay-per-view (PPV). Virtual pay-TV users are also almost 3x as likely to have pirated video content. This over-indexing highlights that these consumers are content-hungry and are able to find the content they need—through paid means or otherwise.
Although virtual pay TV users are highly engaged, price hikes continue to push consumers to fully cut the cord and just rely on SVOD or AVOD services. Average monthly pricing for a vMVPD service in the US in 2021 was $58.89 per month compared to $99.44 for traditional pay TV and $8.75 for SVOD.
While virtual pay TV looks to offer affordable pay-TV to the consumer, the economics of the business model still operate in the same fashion as traditional pay TV. Virtual pay-TV services still pay carriage fees to channel owners to license content. Channel groups often bundle multiple channels together during negotiations to require carriers to take all or nothing. This forces virtual pay-TV services to pay high margin prices for licensing with little margin left over for in-house profits. This also explains why companies in the US that have done well have larger conglomerates backing them (Google and Disney) to offset operational costs. The virtual pay-TV business has struggled to find profitability with small margins causing US average pricing to double from 2017 to 2021.
User Demographics
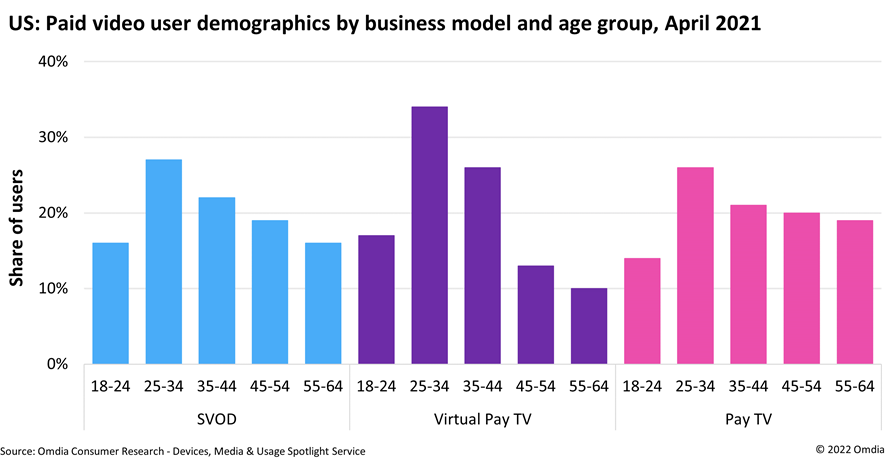
Max Signorelli, Senior Analyst at Omdia, commented: “US virtual pay-TV users skew toward high income 25 to 44-year-old males with interest in TV shows and sports. Live sports is one of the driving growth factors behind virtual pay TV, but it is still niche in size compared to pay TV or SVOD.” US virtual pay TV accounted for 7% of subscription revenue but only 3% of total subscriptions.
Although the US takes the single largest market share for virtual pay TV globally, Western Europe is only slightly behind, with both regions taking around 30% global market share each in 2021. In non-US markets, virtual pay TV can take a variety of formats, catering to all types of consumers at a different price points. BCS Bureau


You must be logged in to post a comment Login